Fig. 11
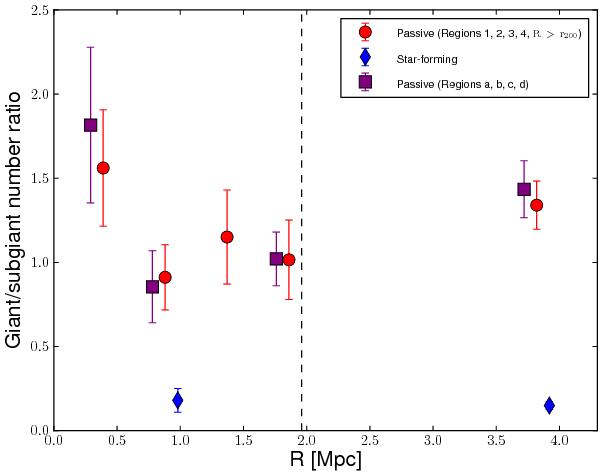
Number ratio of giant galaxies (log M⋆/M⊙ ≥ 10.5) and subgiant galaxies (log M⋆/M⊙< 10.5), GSNR, for different samples of passive galaxies (red dots: Regions 1–4 and R>r200; magenta squares: Regions (a)–(d)) and SF galaxies (blue diamonds: within and outside the virial radius). For Regions (a)–(d) the point abscissae are set at the average clustercentric radii of the galaxies in the subsamples selected on the base of local density. The vertical dashed line indicates the location of r200.
Current usage metrics show cumulative count of Article Views (full-text article views including HTML views, PDF and ePub downloads, according to the available data) and Abstracts Views on Vision4Press platform.
Data correspond to usage on the plateform after 2015. The current usage metrics is available 48-96 hours after online publication and is updated daily on week days.
Initial download of the metrics may take a while.