Fig. 8
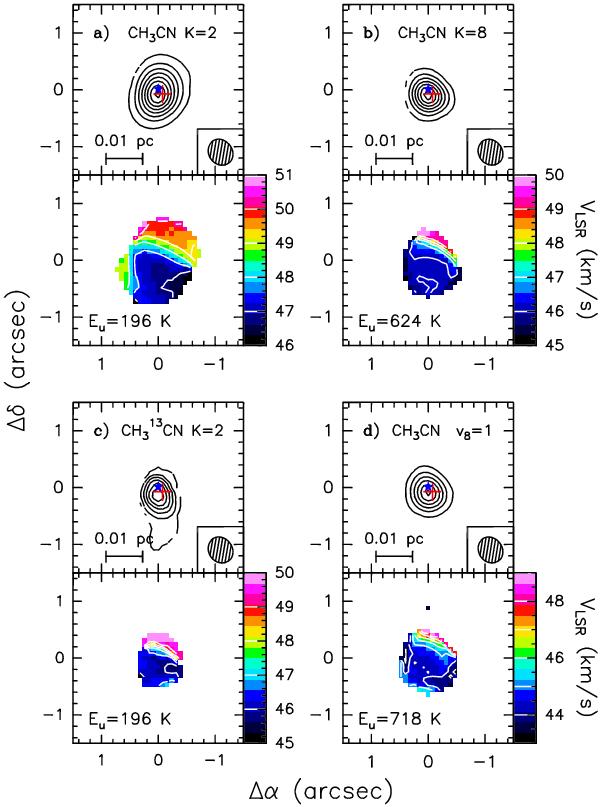
Maps of the integrated intensity (moment 0) (upper panels) and
the line velocity (moment 1) (lower panels) toward core A of
a) CH3CN K = 2, b) CH3CN K = 8, c)
CH CN K = 2, and d)
CH3CN K,l = (3,1)v8 = 1
toward the HMC A in G35.03. Contour levels, which start at 3σ, are a)
0.3 to 4.5 by 0.6 Jy/beam km s-1, b) 0.1 to 1.3 by 0.2
Jy/beam km s-1, c) 0.03 to 0.33 by 0.06
Jy/beam km s-1, and d) 0.1 to 1.1 by 0.2
Jy/beam km s-1. Offsets are measured with respect to the phase
center. The red cross indicates the position of the dust emission peak of core A.
The blue star indicates the position of the compact centimeter source CM2 detected
by Cyganowski et al. (2011). The ALMA
synthesized beam is shown in the lower right corner (upper
panels). The energy of the upper level of each transition is indicated in
the lower left corner (lower panels).
CN K = 2, and d)
CH3CN K,l = (3,1)v8 = 1
toward the HMC A in G35.03. Contour levels, which start at 3σ, are a)
0.3 to 4.5 by 0.6 Jy/beam km s-1, b) 0.1 to 1.3 by 0.2
Jy/beam km s-1, c) 0.03 to 0.33 by 0.06
Jy/beam km s-1, and d) 0.1 to 1.1 by 0.2
Jy/beam km s-1. Offsets are measured with respect to the phase
center. The red cross indicates the position of the dust emission peak of core A.
The blue star indicates the position of the compact centimeter source CM2 detected
by Cyganowski et al. (2011). The ALMA
synthesized beam is shown in the lower right corner (upper
panels). The energy of the upper level of each transition is indicated in
the lower left corner (lower panels).
Current usage metrics show cumulative count of Article Views (full-text article views including HTML views, PDF and ePub downloads, according to the available data) and Abstracts Views on Vision4Press platform.
Data correspond to usage on the plateform after 2015. The current usage metrics is available 48-96 hours after online publication and is updated daily on week days.
Initial download of the metrics may take a while.