Fig. 7
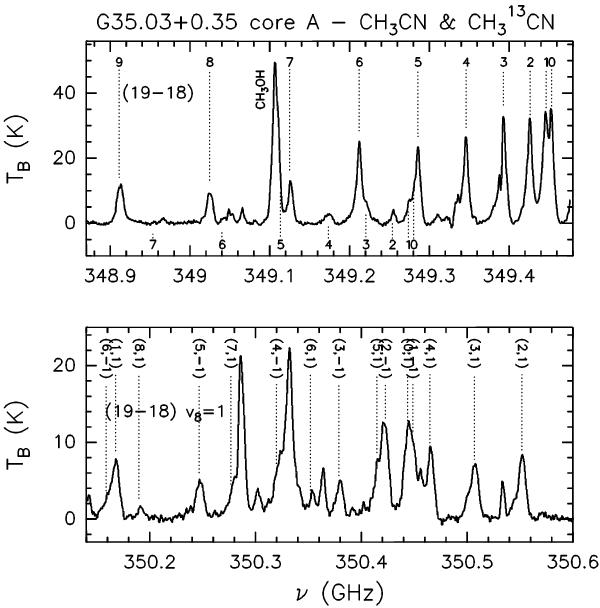
Top panel: CH3CN and CH CN (19–18) spectra obtained toward
the continuum peak position of core A. The different K-components of
CH3CN and
CHCN (given in the upper and lower
part of the panel, respectively) are marked with dashed lines. Bottom
panel: CH3CN (19–18) vibrationally excited (v8 = 1)
spectra for which the different K,l-components are also marked with dashed
lines.
CN (19–18) spectra obtained toward
the continuum peak position of core A. The different K-components of
CH3CN and
CHCN (given in the upper and lower
part of the panel, respectively) are marked with dashed lines. Bottom
panel: CH3CN (19–18) vibrationally excited (v8 = 1)
spectra for which the different K,l-components are also marked with dashed
lines.
Current usage metrics show cumulative count of Article Views (full-text article views including HTML views, PDF and ePub downloads, according to the available data) and Abstracts Views on Vision4Press platform.
Data correspond to usage on the plateform after 2015. The current usage metrics is available 48-96 hours after online publication and is updated daily on week days.
Initial download of the metrics may take a while.