Fig. 6
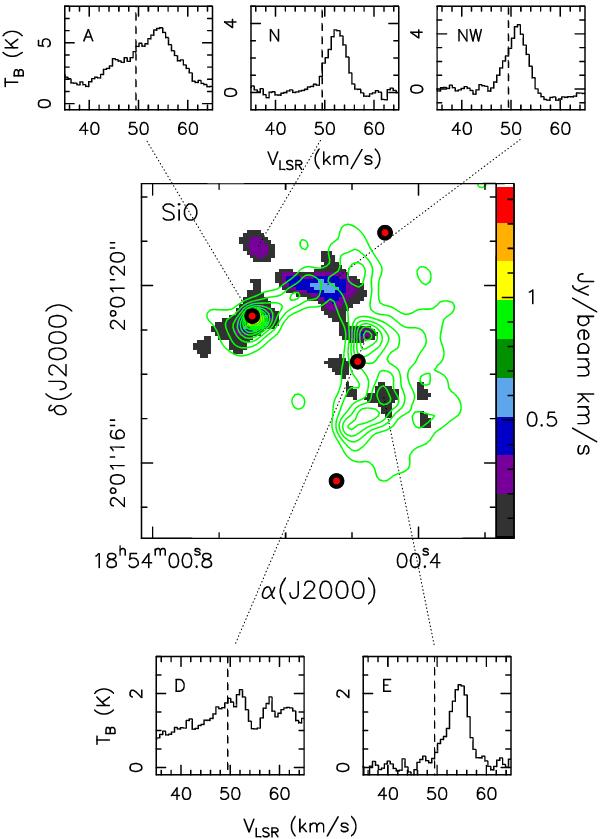
Middle panel: overlay of the 343 GHz continuum emission (green contours) on the integrated intensity (moment 0) map (colors) of SiO (8–7). The contour levels are the same as in Fig. 2. The red circles indicate the positions of the 5 compact centimeter sources detected by Cyganowski et al. (2011). Lower and upper panels: SiO (8–7) spectra toward selected positions in the G35.03 core. The vertical dashed line indicates the VLSR.
Current usage metrics show cumulative count of Article Views (full-text article views including HTML views, PDF and ePub downloads, according to the available data) and Abstracts Views on Vision4Press platform.
Data correspond to usage on the plateform after 2015. The current usage metrics is available 48-96 hours after online publication and is updated daily on week days.
Initial download of the metrics may take a while.