Fig. 5
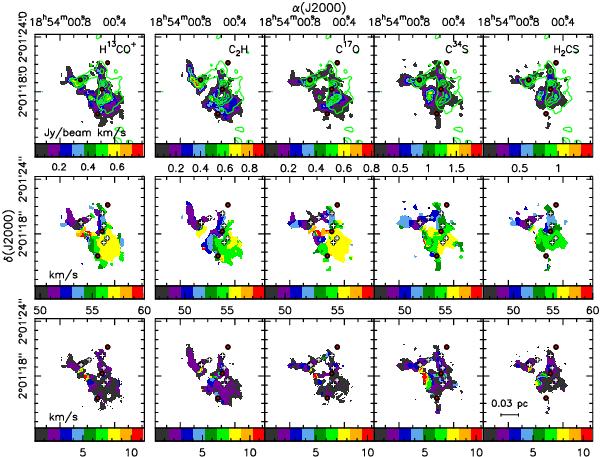
Top panels: overlay of the 343 GHz continuum emission (green contours) on the integrated intensity (moment 0) map (colors) of H13CO+, C2H, C17O, C34S, and H2CS. The green contours range from 8 to 84.8 mJy beam-1 in steps of 19.2 mJy beam-1. Middle panels: line velocity (moment 1) maps for the same molecular species. Bottom panels: velocity dispersion (moment 2) maps for the same species. The red circles indicate the positions of the 5 compact centimeter sources detected by Cyganowski et al. (2011), and the white crosses the positions of the submillimeter continuum cores (Table 3).
Current usage metrics show cumulative count of Article Views (full-text article views including HTML views, PDF and ePub downloads, according to the available data) and Abstracts Views on Vision4Press platform.
Data correspond to usage on the plateform after 2015. The current usage metrics is available 48-96 hours after online publication and is updated daily on week days.
Initial download of the metrics may take a while.