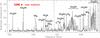
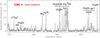
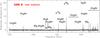
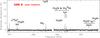
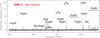
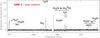
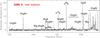
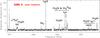
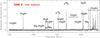
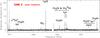
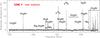
Fig. 4
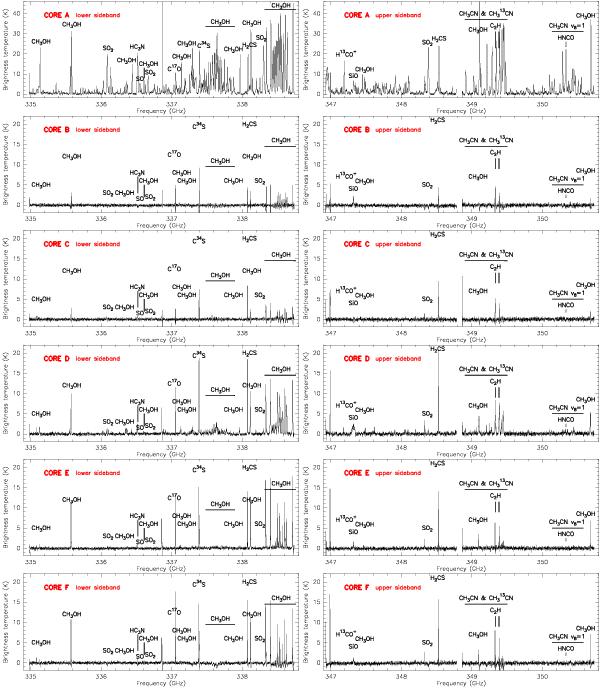
Spectra toward the continuum peak position of the six cores identified in the continuum image at 343 GHz (see Fig. 2). The spectra shown cover the whole frequency range of the ALMA observations: 334.982–338.741 GHz in the lower sideband, and 346.908–350.736 GHz in the upper sideband. The brightness temperature scale of core A (the richest and brightest core) is different from that of the rest of the cores. The absorption visible in some spectra is probably produced by the interferometer filtering out part of the extended emission.
Current usage metrics show cumulative count of Article Views (full-text article views including HTML views, PDF and ePub downloads, according to the available data) and Abstracts Views on Vision4Press platform.
Data correspond to usage on the plateform after 2015. The current usage metrics is available 48-96 hours after online publication and is updated daily on week days.
Initial download of the metrics may take a while.