Free Access
Fig. A.2
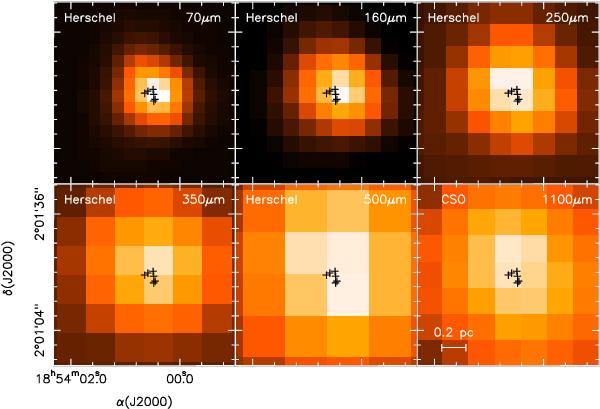
Herschel 70, 160, 250, 350, and 500 μm (from the Hi-GAL survey), and CSO 1100 μm (from the Bolocam survey) images on linear scale toward the star-forming region G35.03. The crosses indicate the positions of the submillimeter continuum cores (Table 3).
Current usage metrics show cumulative count of Article Views (full-text article views including HTML views, PDF and ePub downloads, according to the available data) and Abstracts Views on Vision4Press platform.
Data correspond to usage on the plateform after 2015. The current usage metrics is available 48-96 hours after online publication and is updated daily on week days.
Initial download of the metrics may take a while.