Fig. 23
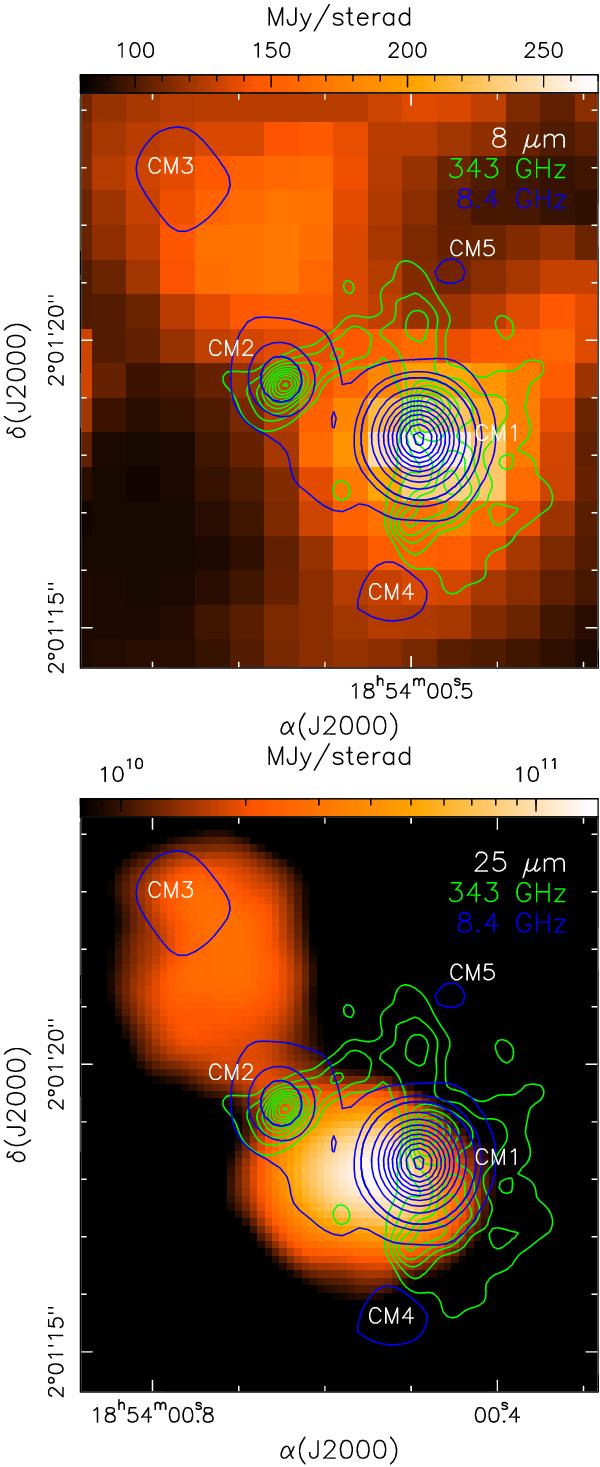
Enhanced-resolution Spitzer 8.0 μm image on linear scale (upper panel) and Subaru COMICS 25 μm image in logarithmic scale (lower panel) toward the central part of G35.03 overlaid with a contour map of the 343 GHz continuum emission (green contours) and of the 8.4 GHz continuum emission (blue contours) from Cyganowski et al. (2011). The original COMICS 25 μm image has been convolved with a Gaussian to obtain an angular resolution of 1′′. Green contours range from 8 to 108.8 mJy beam-1 in steps of 14.4 mJy beam-1. Blue contours range from 0.108 to 0.918 mJy beam-1 in steps of 0.405 mJy beam-1, and from 0.918 to 11.853 mJy beam-1 in steps of 1.215 mJy beam-1.
Current usage metrics show cumulative count of Article Views (full-text article views including HTML views, PDF and ePub downloads, according to the available data) and Abstracts Views on Vision4Press platform.
Data correspond to usage on the plateform after 2015. The current usage metrics is available 48-96 hours after online publication and is updated daily on week days.
Initial download of the metrics may take a while.