Fig. 22
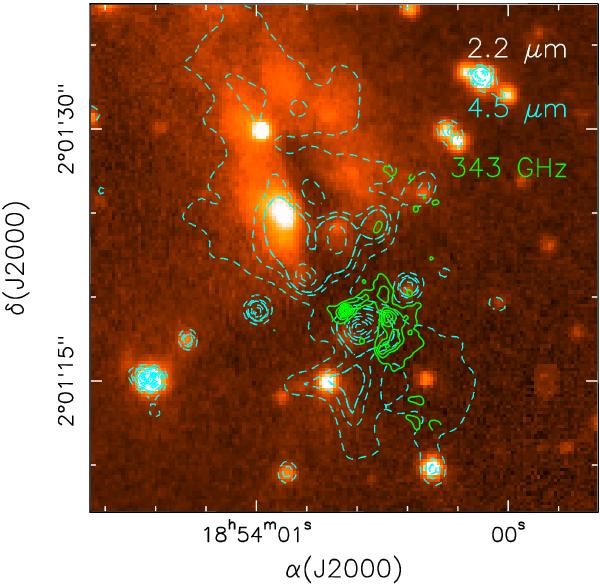
2.2 μm K-band image toward G35.03 from the UKIDSS survey overlaid with a contour map of the enhanced resolution Spitzer 4.5 μm image (cyan contours) and of the 343 GHz continuum emission (green contours). Green contours are the same as in Fig. 2. Only the submillimeter continuum emission inside the ALMA primary beam has been taken into account.
Current usage metrics show cumulative count of Article Views (full-text article views including HTML views, PDF and ePub downloads, according to the available data) and Abstracts Views on Vision4Press platform.
Data correspond to usage on the plateform after 2015. The current usage metrics is available 48-96 hours after online publication and is updated daily on week days.
Initial download of the metrics may take a while.