Fig. 21
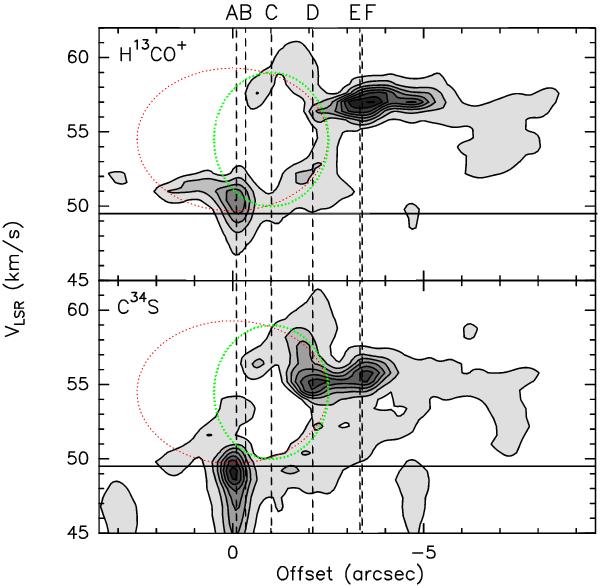
Position-velocity plots along the direction with PA = +45° for H13CO+ and C34S. The offsets are measured from the phase center, positive to the northeast. The vertical dashed lines indicate the position of cores A, B, C, D, E, and F. The horizontal solid line indicates the VLSR. The dotted ellipses outline two possibilities for explaining the morphology of the emission: a cavity centered on core A (red ellipse) or alternatively, a cavity centered close to the IR peak (green ellipse; see Sect. 4.4).
Current usage metrics show cumulative count of Article Views (full-text article views including HTML views, PDF and ePub downloads, according to the available data) and Abstracts Views on Vision4Press platform.
Data correspond to usage on the plateform after 2015. The current usage metrics is available 48-96 hours after online publication and is updated daily on week days.
Initial download of the metrics may take a while.