Fig. 2
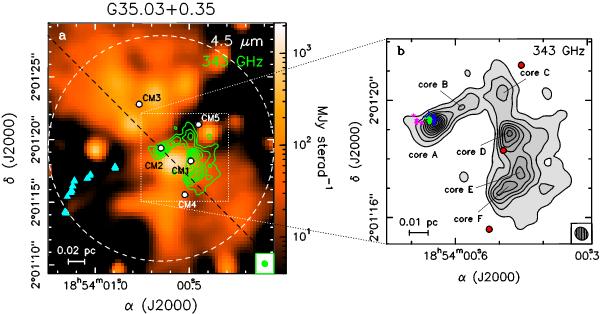
a) Enhanced-resolution Spitzer 4.5 μm image on logarithmic scale toward the star-forming region G35.03 overlaid with a contour map of the 343 GHz continuum emission obtained with ALMA. The IR image has been obtained by applying the high resolution (HiRes) deconvolution algorithm to the Spitzer/IRAC data (Velusamy et al. 2008). The submillimeter map has been corrected for primary beam attenuation. The green contours range from 8 to 94.4 mJy beam-1 in steps of 9.6 mJy beam-1. The cyan triangles indicate the positions of Class I 44 GHz CH3OH masers (Cyganowski et al. 2009). The white circles indicate the positions of the 5 compact centimeter sources detected by Cyganowski et al. (2011). The dashed black line indicates the direction of the 4.5 μm bipolar nebula. The dashed white circle denotes the primary beam of the ALMA 12 m antennas. The ALMA synthesized beam is shown in the lower right corner. b) Close-up of the central region that shows the 343 GHz continuum emission map obtained with ALMA. Blue crosses and magenta stars indicate the positions of H2O and OH masers, respectively (Forster & Caswell 1999), and green triangles those of Class II 6.7 GHz CH3OH masers (Cyganowski et al. (2009).
Current usage metrics show cumulative count of Article Views (full-text article views including HTML views, PDF and ePub downloads, according to the available data) and Abstracts Views on Vision4Press platform.
Data correspond to usage on the plateform after 2015. The current usage metrics is available 48-96 hours after online publication and is updated daily on week days.
Initial download of the metrics may take a while.