Fig. 17
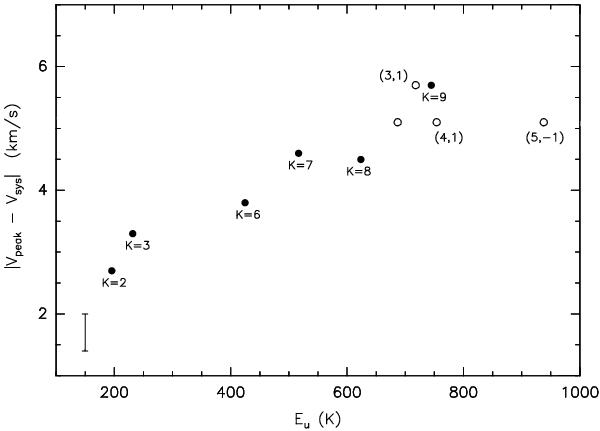
Difference between the velocity of the peak of the emission in the PV plots along the direction with PA = −45° toward core A and the systemic velocity for several transitions of CH3CN and CH3CN v8 = 1 as a function of upper level excitation energy. The systemic velocity Vsys is ~49.5 km s-1. The open circles correspond to the v8 = 1 transitions. The different K and (K,l) transitions are indicated.
Current usage metrics show cumulative count of Article Views (full-text article views including HTML views, PDF and ePub downloads, according to the available data) and Abstracts Views on Vision4Press platform.
Data correspond to usage on the plateform after 2015. The current usage metrics is available 48-96 hours after online publication and is updated daily on week days.
Initial download of the metrics may take a while.