Fig. 14
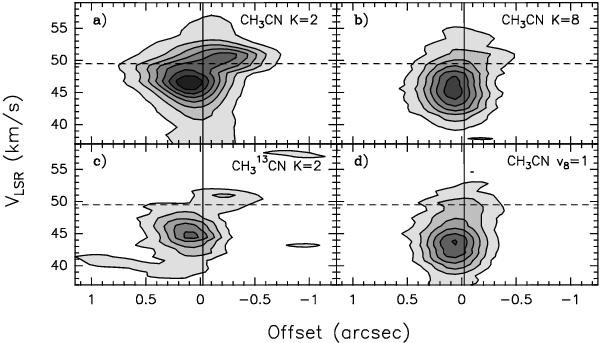
Position-velocity plots along the direction with PA = −45° toward the HMC A for
a) CH3CN K = 2, b) CH3CN K = 8, c)
CH CN K = 2, and d)
CH3CN K,l = (3,1)v8 = 1.
The offsets are measured from the phase center, positive to the southeast. Contour
levels, which start at 3σ, are a) 0.03 to 0.39 by 0.06
Jy beam-1,
b) 0.009 to 0.099 by 0.018 Jy beam-1, c) 0.006
to 0.055 by 0.012 Jy beam-1, and d) 0.01 to 0.09 by 0.015
Jy beam-1.
The vertical solid line indicates the position of core A. The horizontal dashed line
indicates the VLSR.
CN K = 2, and d)
CH3CN K,l = (3,1)v8 = 1.
The offsets are measured from the phase center, positive to the southeast. Contour
levels, which start at 3σ, are a) 0.03 to 0.39 by 0.06
Jy beam-1,
b) 0.009 to 0.099 by 0.018 Jy beam-1, c) 0.006
to 0.055 by 0.012 Jy beam-1, and d) 0.01 to 0.09 by 0.015
Jy beam-1.
The vertical solid line indicates the position of core A. The horizontal dashed line
indicates the VLSR.
Current usage metrics show cumulative count of Article Views (full-text article views including HTML views, PDF and ePub downloads, according to the available data) and Abstracts Views on Vision4Press platform.
Data correspond to usage on the plateform after 2015. The current usage metrics is available 48-96 hours after online publication and is updated daily on week days.
Initial download of the metrics may take a while.