Fig. 13
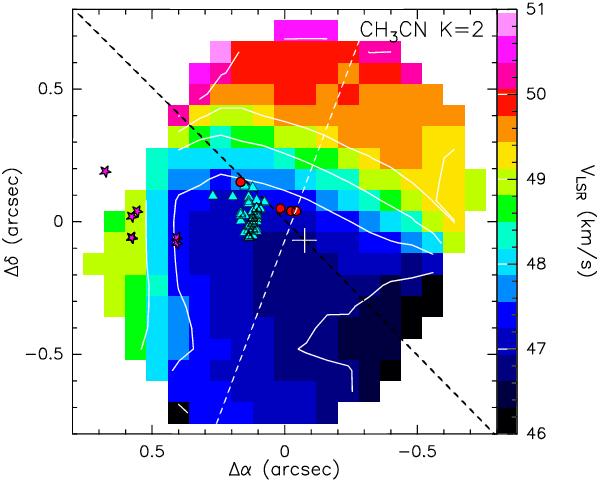
Map of the line velocity (moment 1) of CH3CN K = 2 toward core A. Contour levels are the same as in Fig. 8. The white cross marks the position of the dust emission peak of core A. The dashed white line indicates the direction of the velocity gradient estimated as explained in Sect. 4.3. The dashed black line indicates the direction of the IR bipolar nebula (see Fig. 1). Red circles and magenta stars indicate the positions of H2O and OH masers, respectively (Forster & Caswell 1999), and cyan triangles those of Class II 6.7 GHz CH3OH masers (Cyganowski et al. 2009).
Current usage metrics show cumulative count of Article Views (full-text article views including HTML views, PDF and ePub downloads, according to the available data) and Abstracts Views on Vision4Press platform.
Data correspond to usage on the plateform after 2015. The current usage metrics is available 48-96 hours after online publication and is updated daily on week days.
Initial download of the metrics may take a while.