Fig. 12
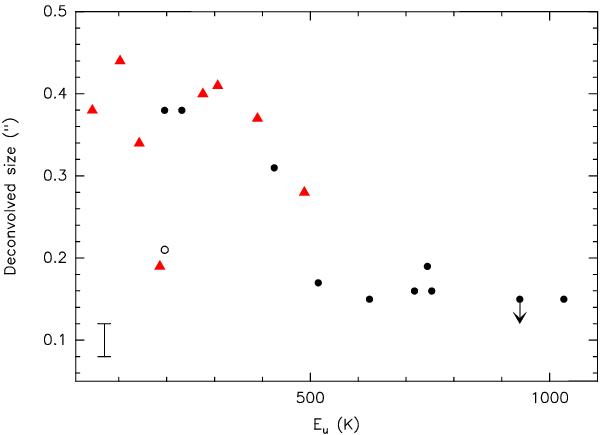
Deconvolved size of the 50% contour level of the integrated emission of the different
transitions shown in Figs. 8−10 versus upper level excitation energy. Black circles correspond to
CH3CN and
CH3CN
v8 =
1 transitions. The black open circle corresponds to the
K = 2
transition of the isotopologue of CH3CN, that is,
CH CN. The black arrow indicates an
upper limit for the deconvolved size because the emission in unresolved. The red
triangles correspond to the other species shown in Figs. 9 and 10. The typical error
bar of the size measurements is shown in the bottom left.
CN. The black arrow indicates an
upper limit for the deconvolved size because the emission in unresolved. The red
triangles correspond to the other species shown in Figs. 9 and 10. The typical error
bar of the size measurements is shown in the bottom left.
Current usage metrics show cumulative count of Article Views (full-text article views including HTML views, PDF and ePub downloads, according to the available data) and Abstracts Views on Vision4Press platform.
Data correspond to usage on the plateform after 2015. The current usage metrics is available 48-96 hours after online publication and is updated daily on week days.
Initial download of the metrics may take a while.