Fig. 10
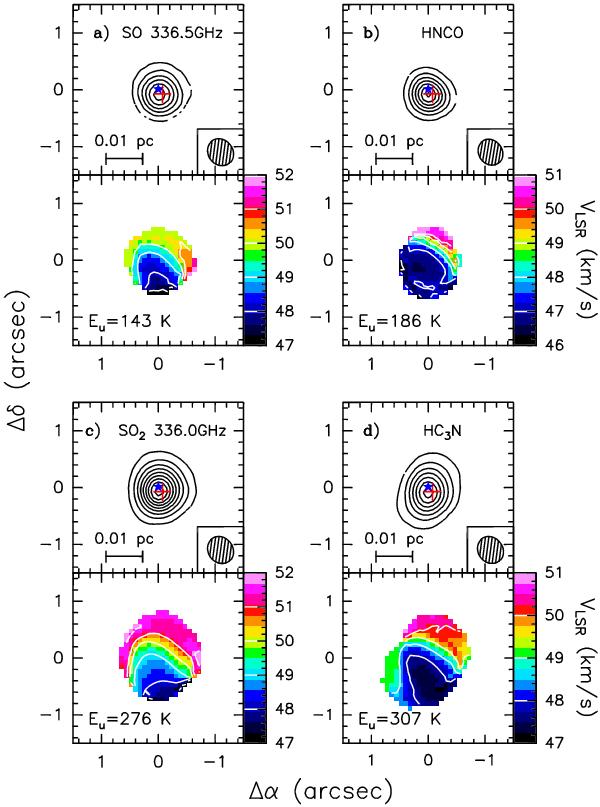
Maps of the integrated intensity (moment 0) (upper panels) and the line velocity (moment 1) (lower panels) toward core A of a) SO (1011–1010), b) HNCO (161,16–151,15), c) SO2 (233,21–232,22), and d) HC3N (37–36) toward the HMC A in G35.03. Contour levels, which start at 3σ, are 0.08 to 0.88 by 0.16 Jy/beam km s-1b) 0.3 to 3.9 by 0.6 Jy/beam km s-1, c) 0.2 to 3.4 by 0.4 Jy/beam km s-1, and d) 0.3 to 3.9 by 0.6 Jy/beam km s-1. Offsets are measured with respect to the phase center. The symbols are the same as in Fig. 8.
Current usage metrics show cumulative count of Article Views (full-text article views including HTML views, PDF and ePub downloads, according to the available data) and Abstracts Views on Vision4Press platform.
Data correspond to usage on the plateform after 2015. The current usage metrics is available 48-96 hours after online publication and is updated daily on week days.
Initial download of the metrics may take a while.