Fig. 1
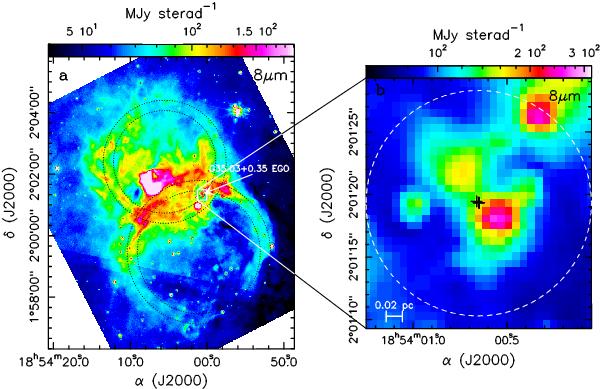
a)Spitzer 8.0 μm image on logarithmic scale toward N65 (Churchwell et al. 2006). The dotted circles outline the borders of the two bubbles. The white arrow indicates the G35.05+0.35 bipolar EGO identified by Cyganowski et al. (2008). b) Close-up toward the position of the G35.05+0.35 EGO showing the bipolar nebulosity at 8 μm. Black crosses indicate the positions of H2O masers (Forster & Caswell 1999). The white circle denotes the primary beam of the ALMA observations.
Current usage metrics show cumulative count of Article Views (full-text article views including HTML views, PDF and ePub downloads, according to the available data) and Abstracts Views on Vision4Press platform.
Data correspond to usage on the plateform after 2015. The current usage metrics is available 48-96 hours after online publication and is updated daily on week days.
Initial download of the metrics may take a while.