Fig. 2
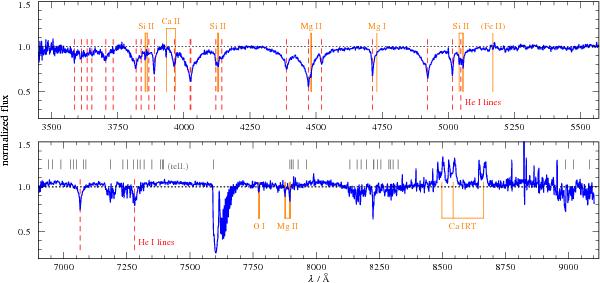
Normalized, co-added spectrum of Ton 345. The (red) dashed, vertical lines show the photospheric He i absorption lines. Other absorption features from the metal pollution of the WD atmosphere and the disk Ca IRT emission are indicated by (orange) solid, vertical lines. In the lower panel the telluric lines are marked by the (gray) upper tickmarks.
Current usage metrics show cumulative count of Article Views (full-text article views including HTML views, PDF and ePub downloads, according to the available data) and Abstracts Views on Vision4Press platform.
Data correspond to usage on the plateform after 2015. The current usage metrics is available 48-96 hours after online publication and is updated daily on week days.
Initial download of the metrics may take a while.