Fig. 1
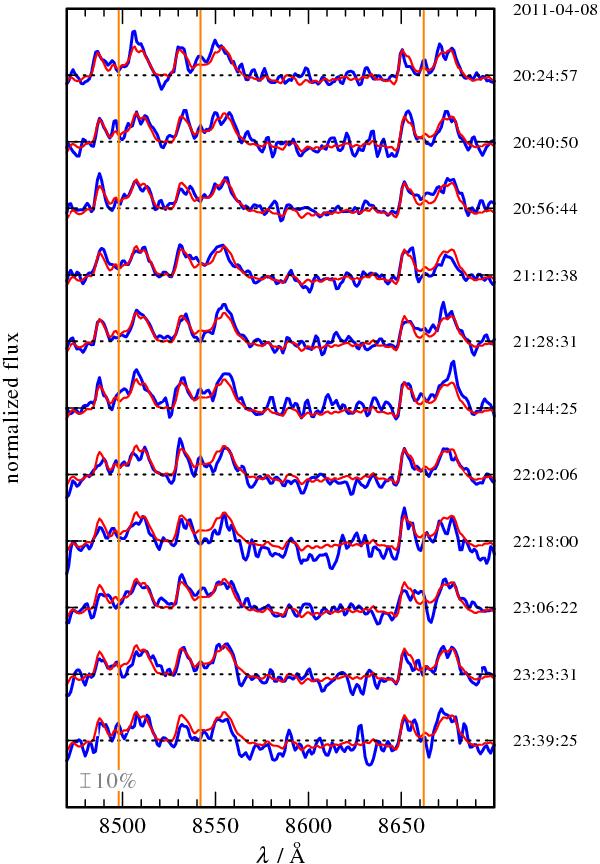
Ca ii infrared triplet in the 900 s-exposure normalized spectra of Ton 345 (blue in the online version, thick line), overlaid by the co-added spectrum (red, thin line). Vertical lines (orange) indicate the rest wavelengths of the triplet. The dotted, horizontal lines display the normalized flux value of unity for each observation. The vertical bar represents 10% of the continuum flux.
Current usage metrics show cumulative count of Article Views (full-text article views including HTML views, PDF and ePub downloads, according to the available data) and Abstracts Views on Vision4Press platform.
Data correspond to usage on the plateform after 2015. The current usage metrics is available 48-96 hours after online publication and is updated daily on week days.
Initial download of the metrics may take a while.