Fig. 4
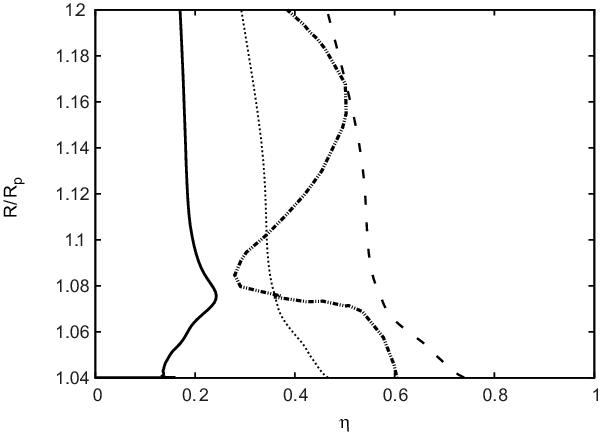
Heating efficiency ηhν with (solid curve) and ηpe without (dashed curve) the photoelectron impact processes (5) in the H2 →H transition region in the upper atmosphere of HD 209458b. For comparison the heating efficiency presented in Fig. 4 in the study by Yelle (2004) is shown as the dotted-dashed line. The dotted line represents the heating efficiency ηpe reduced by a factor 0.63 in accordance with the approach applied by Yelle (2004).
Current usage metrics show cumulative count of Article Views (full-text article views including HTML views, PDF and ePub downloads, according to the available data) and Abstracts Views on Vision4Press platform.
Data correspond to usage on the plateform after 2015. The current usage metrics is available 48-96 hours after online publication and is updated daily on week days.
Initial download of the metrics may take a while.