Fig. 3
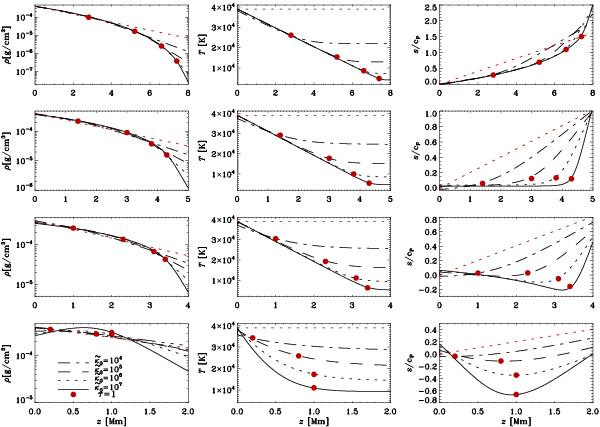
Density, temperature and entropy of the equilibrium state versus height, from left to right, for Sets A, B, C and D, from top to bottom. The four different lines in each plot corresponds to the value of the rescaled opacity ![]() , 105, 106, 107 Mm-1 cm3 g-1. The dots in all plots represent the surface τ ≈ 1. The red dashed lines represent the initial profile of each set.
, 105, 106, 107 Mm-1 cm3 g-1. The dots in all plots represent the surface τ ≈ 1. The red dashed lines represent the initial profile of each set.
Current usage metrics show cumulative count of Article Views (full-text article views including HTML views, PDF and ePub downloads, according to the available data) and Abstracts Views on Vision4Press platform.
Data correspond to usage on the plateform after 2015. The current usage metrics is available 48-96 hours after online publication and is updated daily on week days.
Initial download of the metrics may take a while.