Fig. 14
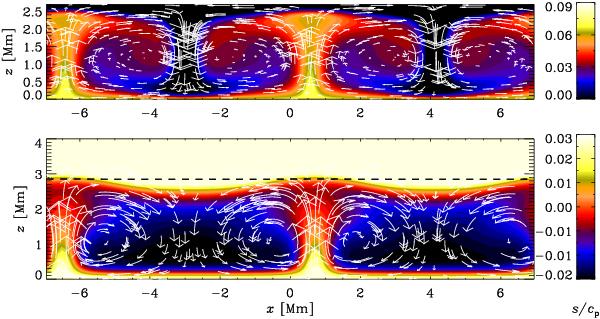
Comparison of velocity and entropy distribution in two-dimensional convection using the optically thick approximation with a radiative upper boundary condition (upper panel) and radiative transfer (lower panel). In both cases we have Pr = 100 and ![]() , corresponding to Ra = 3.6 × 10⁴. In the lower panel, the dashed line gives the contour τ = 1. In order to compare similar structures in the two plots, we have extended the color table of the lower panel to slightly more negative values of s and have clipped it at high values, which are dominated by the strong increase of s above the τ = 1 surface.
, corresponding to Ra = 3.6 × 10⁴. In the lower panel, the dashed line gives the contour τ = 1. In order to compare similar structures in the two plots, we have extended the color table of the lower panel to slightly more negative values of s and have clipped it at high values, which are dominated by the strong increase of s above the τ = 1 surface.
Current usage metrics show cumulative count of Article Views (full-text article views including HTML views, PDF and ePub downloads, according to the available data) and Abstracts Views on Vision4Press platform.
Data correspond to usage on the plateform after 2015. The current usage metrics is available 48-96 hours after online publication and is updated daily on week days.
Initial download of the metrics may take a while.