Free Access
Fig. 1
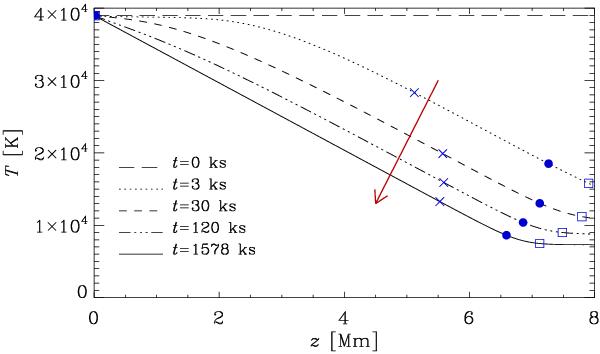
Vertical temperature profile at five different times t = 0, 3, 30, 120, and 1578 ks for Run A6 with ![]() . Squares, circles and crosses represent different optical depths τ = 0.1, τ = 1 and τ = 10, respectively. The arrow represents the direction of the time evolution of the temperature profile.
. Squares, circles and crosses represent different optical depths τ = 0.1, τ = 1 and τ = 10, respectively. The arrow represents the direction of the time evolution of the temperature profile.
Current usage metrics show cumulative count of Article Views (full-text article views including HTML views, PDF and ePub downloads, according to the available data) and Abstracts Views on Vision4Press platform.
Data correspond to usage on the plateform after 2015. The current usage metrics is available 48-96 hours after online publication and is updated daily on week days.
Initial download of the metrics may take a while.