Free Access
Fig. 7
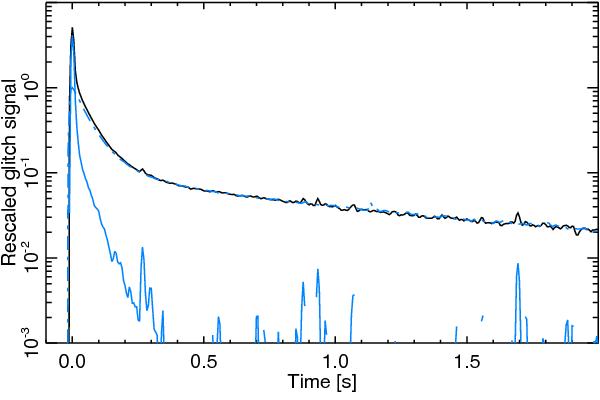
Comparison of a long glitch (black) and a slow glitch (dot-dashed blue). For this plot, the two high energy events were rescaled to match after 200 ms. The difference is shown in blue.
Current usage metrics show cumulative count of Article Views (full-text article views including HTML views, PDF and ePub downloads, according to the available data) and Abstracts Views on Vision4Press platform.
Data correspond to usage on the plateform after 2015. The current usage metrics is available 48-96 hours after online publication and is updated daily on week days.
Initial download of the metrics may take a while.