Fig. 3
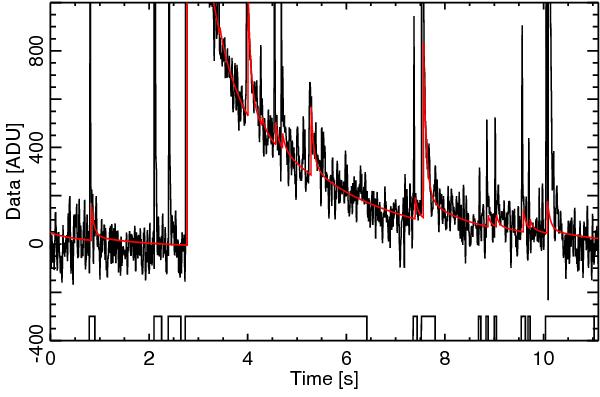
Black: segment of raw data for one detector at 143 GHz before any deglitching; an estimate of the sky signal has been subtracted. Red: a time stream reconstructed from the estimated templates of long glitches with the method presented in Sect. 3.1. We have chosen a region in the vicinity of a large event. Data that are flagged for the analysis are indicated by the lines at the bottom of the figure. Notice the high level of confusion between long glitch signals.
Current usage metrics show cumulative count of Article Views (full-text article views including HTML views, PDF and ePub downloads, according to the available data) and Abstracts Views on Vision4Press platform.
Data correspond to usage on the plateform after 2015. The current usage metrics is available 48-96 hours after online publication and is updated daily on week days.
Initial download of the metrics may take a while.