Fig. 23
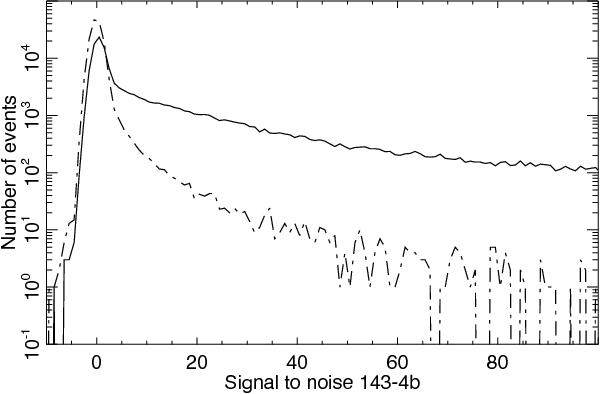
Distributions of the signal values in PSB-b for short events with peak amplitudes between 300 and 1000σ in PSB-a (solid line). A random distribution of values in PSB-b is also shown (dot-dashed line). The excess of the solid curve over the dot-dashed curve for amplitudes above 3σ represents about 50% of the total area. Thus, at least 50% percent of the events are in coincidence between PSB-a and PSB-b.
Current usage metrics show cumulative count of Article Views (full-text article views including HTML views, PDF and ePub downloads, according to the available data) and Abstracts Views on Vision4Press platform.
Data correspond to usage on the plateform after 2015. The current usage metrics is available 48-96 hours after online publication and is updated daily on week days.
Initial download of the metrics may take a while.