Fig. 19
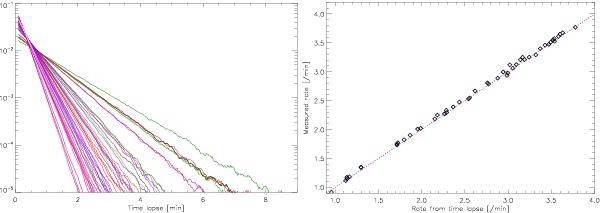
Left: time interval between two consecutive glitch events for each bolometer, normalized by the total number of events. Colours distinguish different detectors. We observe Poisson distributions, as expected for random events. Right: glitch rate derived from the slope of the time interval distribution, compared to the mission averaged actual rate for each bolometer.
Current usage metrics show cumulative count of Article Views (full-text article views including HTML views, PDF and ePub downloads, according to the available data) and Abstracts Views on Vision4Press platform.
Data correspond to usage on the plateform after 2015. The current usage metrics is available 48-96 hours after online publication and is updated daily on week days.
Initial download of the metrics may take a while.