Fig. 13
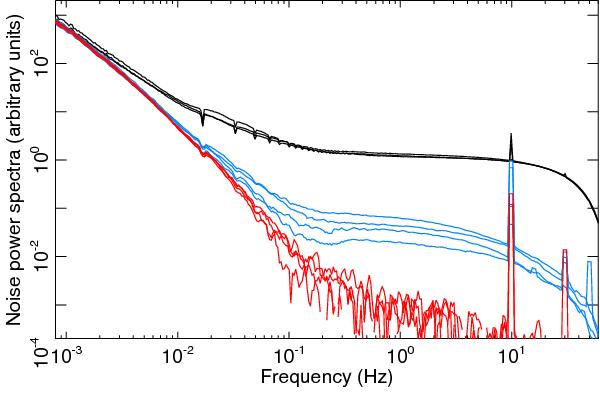
Cross- and auto-power spectra between detectors at 100 GHz. Spectra are computed in the same way as described in the caption of Fig. 12. Black curves correspond to some of the auto-spectra shown in the same figure. Data have been rescaled so that auto-spectra match at 20 Hz, and so that the white noise level is approximately unity. Blue curves correspond to cross-spectra between detectors from the same pair. Red curves are for detectors from different pairs. The extra correlation observed for PSB pair bolometers, above 0.1 Hz and at the level of 2 to 7% of the white noise spectrum, is due to residual glitches below the threshold. Some residual correlation at the level of about 0.1% at 0.2 Hz can be seen between other bolometer pairs that are spatially close to each other; this might result from imperfect sky signal subtraction due to pointing drift, since the error is coherent between different nearby detectors. The low frequency noise is highly correlated between detectors and is due to thermal fluctuations of the focal plane. The level of correlation of the 4 K lines in the plot is not representative of the residual obtained after the TOI processing.
Current usage metrics show cumulative count of Article Views (full-text article views including HTML views, PDF and ePub downloads, according to the available data) and Abstracts Views on Vision4Press platform.
Data correspond to usage on the plateform after 2015. The current usage metrics is available 48-96 hours after online publication and is updated daily on week days.
Initial download of the metrics may take a while.