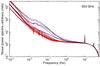
Fig. 12
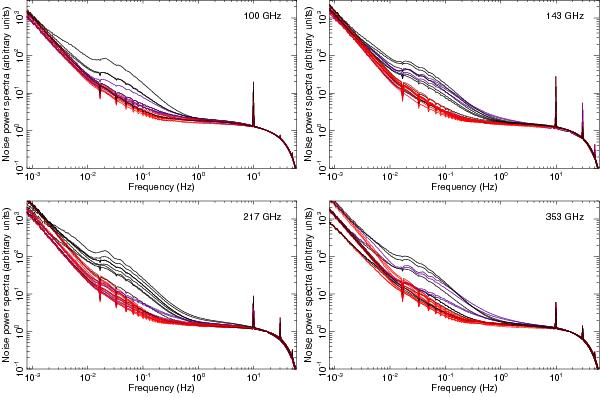
Power spectra of the component of noise that does not project onto the sky, for each bolometer at frequencies between 100 GHz (top left panel) and 353 GHz (bottom right panel). Black curves correspond to the power spectra without subtraction of templates for PSB-b and SWB detectors, while the blue curves are for PSB-a detectors. Power spectra are rescaled in amplitude so that they all match at 20 Hz. The red curves are with template subtraction. Power spectra are computed over subsets of about 100 rings and are averaged over the nominal mission. The sky signal has been previously subtracted from the data. This creates the narrow dips in the spectra at the harmonics of the spin frequency. Data have also been three-point filtered and flagged after glitch detection. The large spikes in the spectra, unsubtracted at this stage, are induced by the 4 K J-T cooler and are described in Planck Collaboration VI (2014). The roll-off of the spectra above 10 Hz is mainly due to the three-point filter. Glitches contribute to the power spectra between 0.002 Hz and 2 Hz. The power spectra of residual contamination is significantly reduced after glitch template subtraction, at frequencies below a few hertz. There is much less dispersion between the power spectra from different detectors after correction – less than a factor of two – indicating that contamination from remaining glitches is not a dominant effect.
Current usage metrics show cumulative count of Article Views (full-text article views including HTML views, PDF and ePub downloads, according to the available data) and Abstracts Views on Vision4Press platform.
Data correspond to usage on the plateform after 2015. The current usage metrics is available 48-96 hours after online publication and is updated daily on week days.
Initial download of the metrics may take a while.