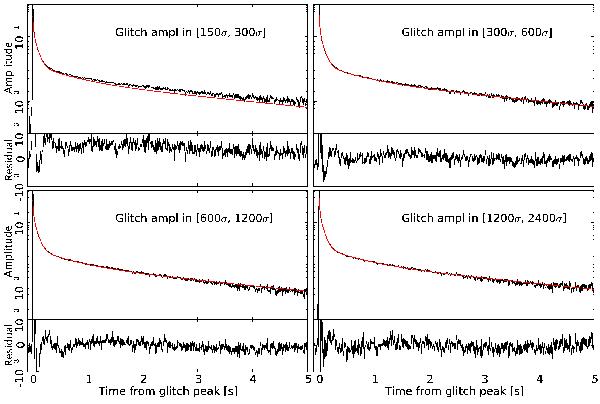
Fig. 10

Stacking of long glitches of bolometer 143-3a in different energy windows, after normalizing each event to the maximum amplitude. The solid lines show the long glitch template obtained after fitting four exponentials, using the data shown in the lower right panel. Templates are rescaled in amplitude in each pannel to match the stacked data due to the nonlinearity of the long glitch tail relative to the peak presented in Sect. 2.2. In each panel the lower curve shows the difference between the stacked data and the template. There is good agreement between the template and the stacked data, typically within 1%.
Current usage metrics show cumulative count of Article Views (full-text article views including HTML views, PDF and ePub downloads, according to the available data) and Abstracts Views on Vision4Press platform.
Data correspond to usage on the plateform after 2015. The current usage metrics is available 48-96 hours after online publication and is updated daily on week days.
Initial download of the metrics may take a while.


