


Fig. 23
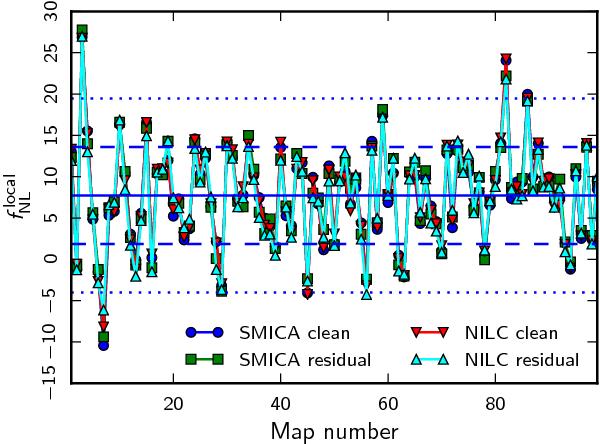
The measured  for the first 99 maps in the lensed FFP6 simulation sample used for the foreground studies presented in Sect. 8.4. We show measurements from SMICA and NILC processed maps both with and without foreground residuals. The horizontal solid line is the average value of the SMICA clean maps, and the dashed and dotted horizontal lines correspond to 1σ and 2σ deviations, respectively. The plot clearly shows the very small impact of including residuals, and the very good consistency between the two component separation pipelines.
Current usage metrics show cumulative count of Article Views (full-text article views including HTML views, PDF and ePub downloads, according to the available data) and Abstracts Views on Vision4Press platform.
Data correspond to usage on the plateform after 2015. The current usage metrics is available 48-96 hours after online publication and is updated daily on week days.
Initial download of the metrics may take a while.