


Fig. 21
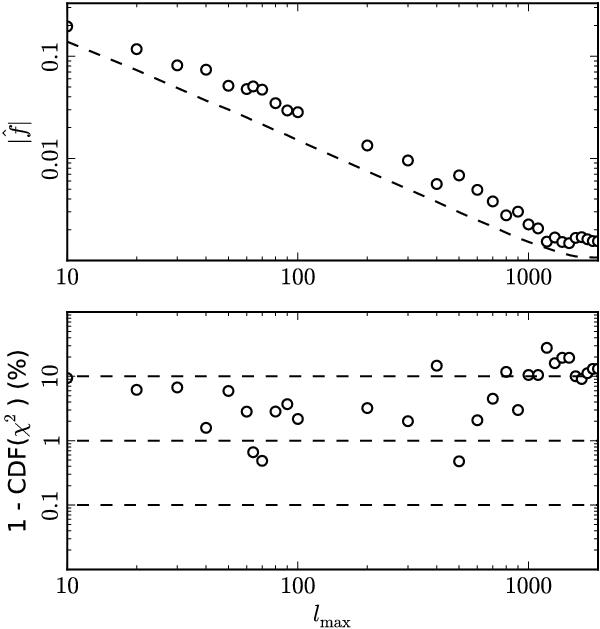
Dependence of the dipole modulation amplitude as a function of ℓmax. Upper panel: the amplitude  of the dipole of the reconstructed power modulation from 143 × 217 GHz maps with the kinematic dipole subtracted; the dashed line shows that the observed signal decreases with ℓmax in the same way as the rms value expected from simulations. Lower panel: corresponding confidence values for the observed dipole of the modulation power spectrum
  assuming it followed a chi-squared distribution; this shows the anomalous-looking results for ℓmax ~ 60 and ℓmax ~ 600 consistent with Planck Collaboration XXVII (2014), but that on smaller scales the observed signal is consistent with isotropy as expected from the scale-invariant
  constraint using ℓmax = 2000 shown in Fig. 17.
Current usage metrics show cumulative count of Article Views (full-text article views including HTML views, PDF and ePub downloads, according to the available data) and Abstracts Views on Vision4Press platform.
Data correspond to usage on the plateform after 2015. The current usage metrics is available 48-96 hours after online publication and is updated daily on week days.
Initial download of the metrics may take a while.