Fig. 17
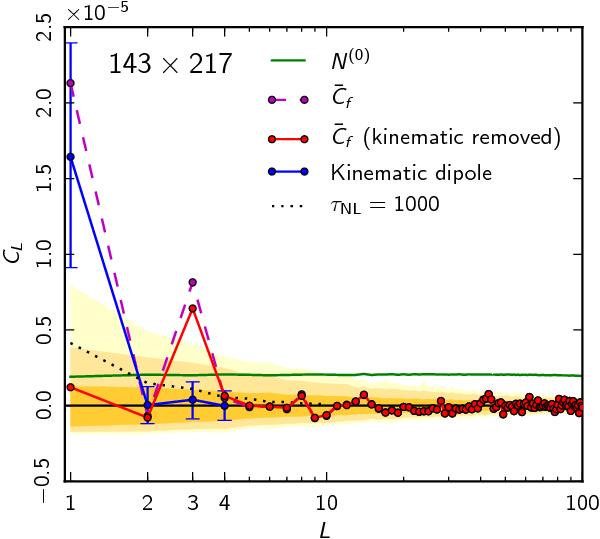
Power spectrum of the power modulation reconstructed from 143 × 217 GHz maps. Shading shows the 68%, 95% and 99% CL intervals from simulations with no modulation or kinematic signal. The dashed lines are when the mean field simulations include no kinematic effects, showing a clear detection of a modulation dipole. The blue points show the expected kinematic modulation dipole signal from simulations, along with 1σ error bars (only first four points shown for clarity). The solid line subtracts the dipolar kinematic signal in the mean fields from simulations including the expected signal, and represents out best estimate of the non-kinematic signal (note this is not just a subtraction of the power spectra since the mean field takes out the fixed dipole anisotropy in real space before calculating the remaining modulation power). The dotted line shows the expected signal for τNL = 1000.
Current usage metrics show cumulative count of Article Views (full-text article views including HTML views, PDF and ePub downloads, according to the available data) and Abstracts Views on Vision4Press platform.
Data correspond to usage on the plateform after 2015. The current usage metrics is available 48-96 hours after online publication and is updated daily on week days.
Initial download of the metrics may take a while.