


Fig. 16
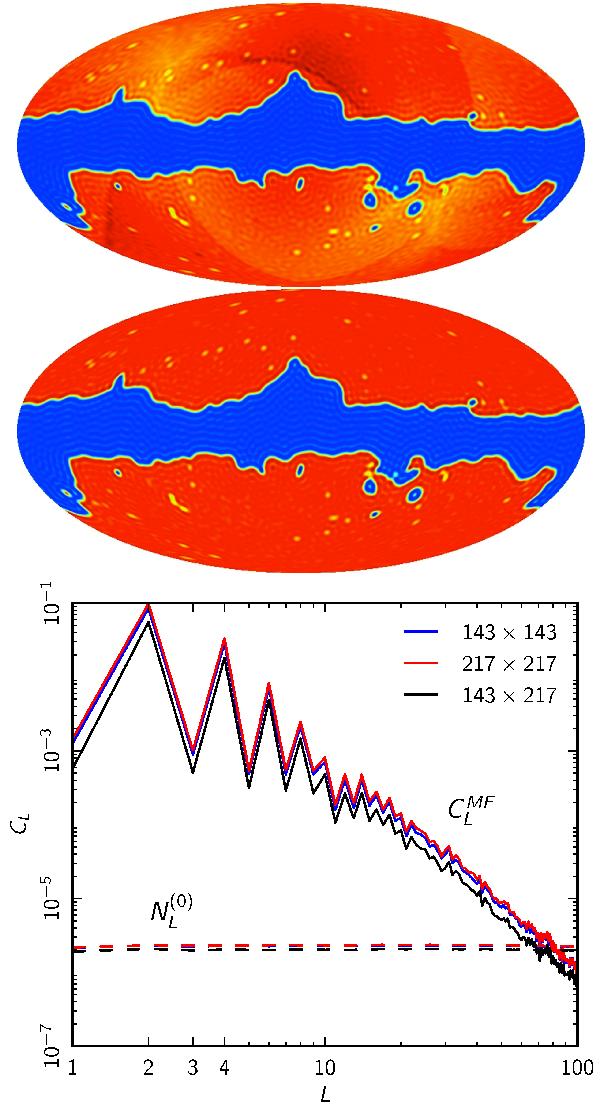
The two upper maps show the modulation reconstruction mean field  at L ≤ 100, which is essentially a map of the expected total small-scale power on the masked map as a function of position (assuming there is no primordial power modulation). The top mean field map from the 143 GHz auto estimator has a large signal from both the cut (which can be calculated accurately), and from the noise anisotropy (aligned roughly with the ecliptic, which cannot be estimated very accurately from simulations). The lower mean field is the 143 × 217 GHz cross-estimator map, and does not have the contribution from the noise anisotropy (note the colour scale is adjusted). The lower plot shows the corresponding mean field power spectra compared to the reconstruction noise
  (connected part of the trispectrum); the reconstruction noise is much smaller than both the detector noise and mask contributions to the mean field. Since any τNL signal is all on large scales we do not reconstruct modes above Lmax = 100.


Current usage metrics show cumulative count of Article Views (full-text article views including HTML views, PDF and ePub downloads, according to the available data) and Abstracts Views on Vision4Press platform.
Data correspond to usage on the plateform after 2015. The current usage metrics is available 48-96 hours after online publication and is updated daily on week days.
Initial download of the metrics may take a while.