


Fig. 15
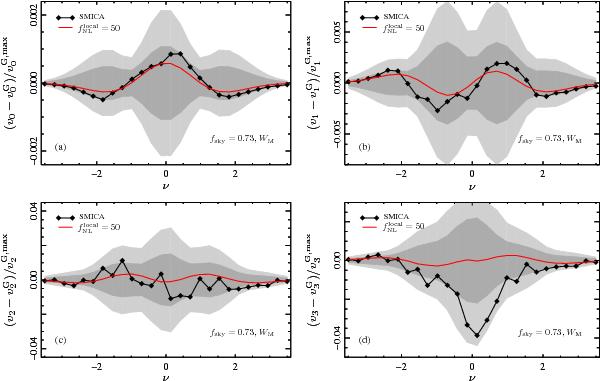
MFs curves for SMICA at Nside = 1024 and ℓmax = 2000, for the four functionals vk: a) area, b) perimeter, c) genus, and d) Ncluster. The curves are the difference of each normalized MF, measured from the data, to the average from Gaussian Planck realistic simulations (not lensed). The difference curves are normalized by the maximum of the Gaussian curve. To compare the curves to the presence of primordial NG, the average difference curves for non-Gaussian simulations with  is also represented (100 simulations).
Current usage metrics show cumulative count of Article Views (full-text article views including HTML views, PDF and ePub downloads, according to the available data) and Abstracts Views on Vision4Press platform.
Data correspond to usage on the plateform after 2015. The current usage metrics is available 48-96 hours after online publication and is updated daily on week days.
Initial download of the metrics may take a while.