


Fig. 10
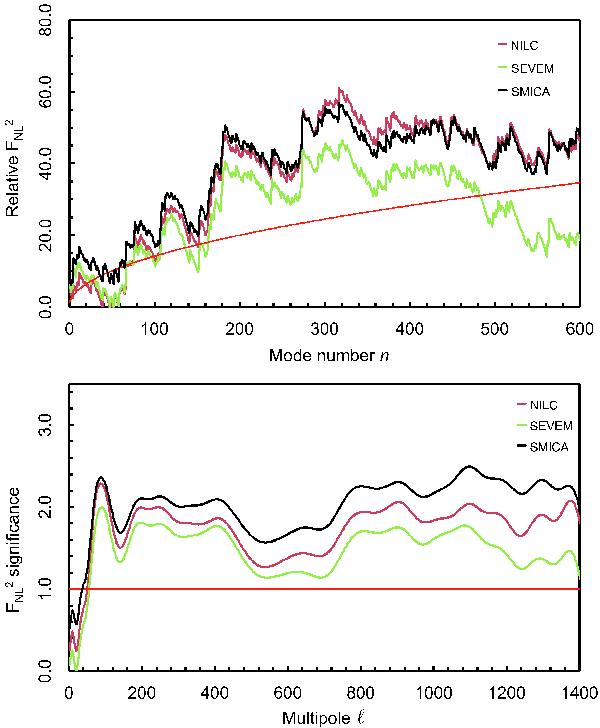
Total integrated bispectrum  defined in Eq. (66) as a cumulative sum over orthonormal modal coefficients
  (upper panel) and over multipoles up to a given ℓ (lower panel). Above, the relative quantity
  is plotted, where
  is the mean obtained from 200 CMB Gaussian maps with the standard deviation shown as the red line. Below the square of the bispectrum is integrated over the tetrapyd out to ℓ and its significance plotted relative to the Gaussian standard deviation (1σ red line). A hybrid polynomial basis nmax = 600 is employed in the signal-dominated region ℓ ≤ 1500.
Current usage metrics show cumulative count of Article Views (full-text article views including HTML views, PDF and ePub downloads, according to the available data) and Abstracts Views on Vision4Press platform.
Data correspond to usage on the plateform after 2015. The current usage metrics is available 48-96 hours after online publication and is updated daily on week days.
Initial download of the metrics may take a while.