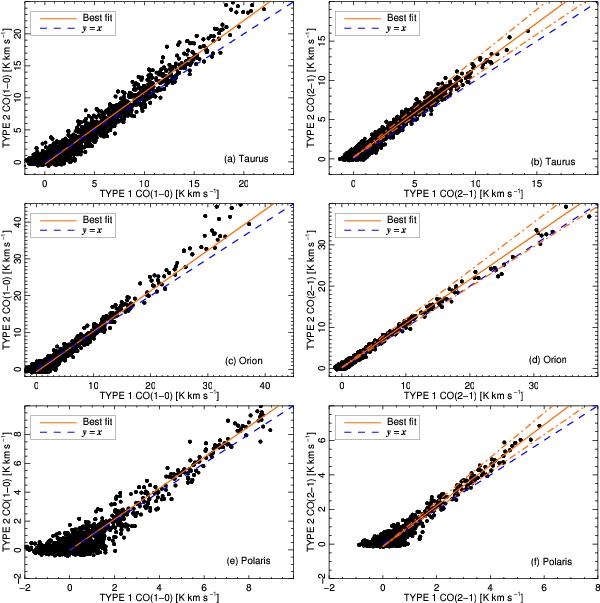
Fig. 9

Correlation between Type 1 and Type 2 CO maps at 115 GHz (left column) and 230 GHz (right column) in the Taurus (top), Orion (middle) and Polaris (bottom) molecular clouds. The best linear fits (orange solid line) have been computed between 2 and 15 K km s-1 at 115 GHz and between 1 and 15 K km s-1 at 230 GHz, where bulk of the data lie and avoiding the noise around zero. The best-fit slopes and uncertainties are: a)1.12 ± 0.03; b) 1.14 ± 0.01; c) 1.10 ± 0.04; d) 1.07 ± 0.01; e) 1.07 ± 0.06; and f) 1.17 ± 0.04. The intercepts are compatible with zero within error bars. The orange dot-dashed lines in the bottom panels correspond to the recalibration uncertainty due to the contribution of the J = 3 → 2 line in the Type 2 J = 2 → 1 product. See text for detail.
Current usage metrics show cumulative count of Article Views (full-text article views including HTML views, PDF and ePub downloads, according to the available data) and Abstracts Views on Vision4Press platform.
Data correspond to usage on the plateform after 2015. The current usage metrics is available 48-96 hours after online publication and is updated daily on week days.
Initial download of the metrics may take a while.


