Fig. 12

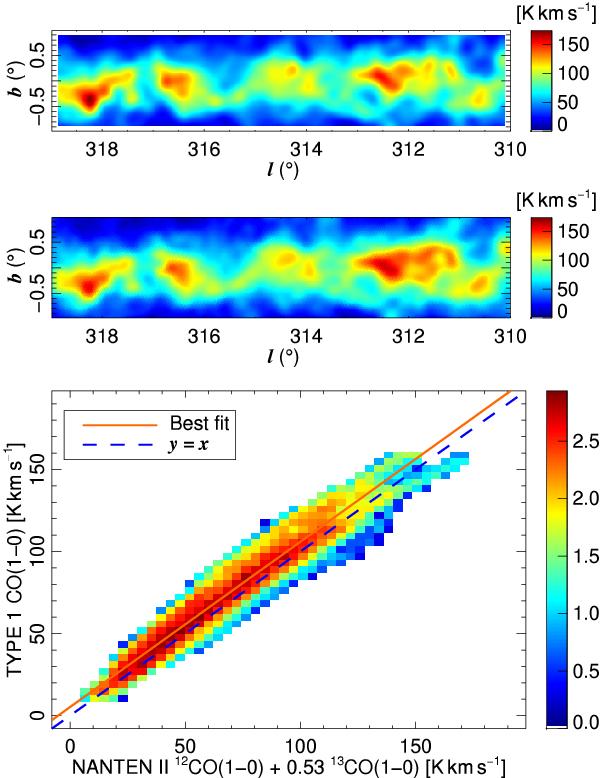
Comparison of the Planck (J = 1 → 0) Type 1 map to the NANTEN II survey in a 9° × 2° section of the Galactic plane. Top: combined NANTEN II map as 12CO + 0.53 × 13CO, where the factor applied to 13CO corresponds to the bandpass estimate of the 13CO contamination in the Type 1 map (see Sect. 6.2.2). Middle: Planck Type 1 J = 1 → 0 map. Bottom: correlation plot between the two maps. The colour scale represents the logarithm of the number of pixels in a given intensity bin. The solid and dashed lines represent perfect correlation (y = x) and the best linear fit, respectively. The best-fit slope and intercept are 1.007 ± 0.001 and 5.243 ± 0.032, respectively.
Current usage metrics show cumulative count of Article Views (full-text article views including HTML views, PDF and ePub downloads, according to the available data) and Abstracts Views on Vision4Press platform.
Data correspond to usage on the plateform after 2015. The current usage metrics is available 48-96 hours after online publication and is updated daily on week days.
Initial download of the metrics may take a while.


