Free Access
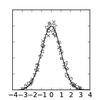
Fig. D.2
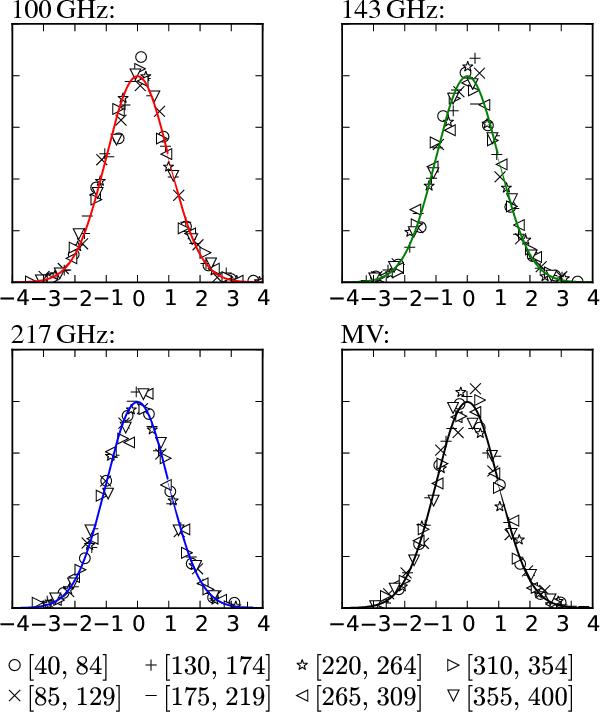
Histograms of amplitude coefficients for the bandpowers of Table 1, taken from 1000 simulated lens reconstructions. Each coefficient has been rescaled by its standard deviation so that it can be directly compared to a unit-variance Gaussian distribution (solid lines).
This figure is made of several images, please see below:
Current usage metrics show cumulative count of Article Views (full-text article views including HTML views, PDF and ePub downloads, according to the available data) and Abstracts Views on Vision4Press platform.
Data correspond to usage on the plateform after 2015. The current usage metrics is available 48-96 hours after online publication and is updated daily on week days.
Initial download of the metrics may take a while.