Fig. A.5
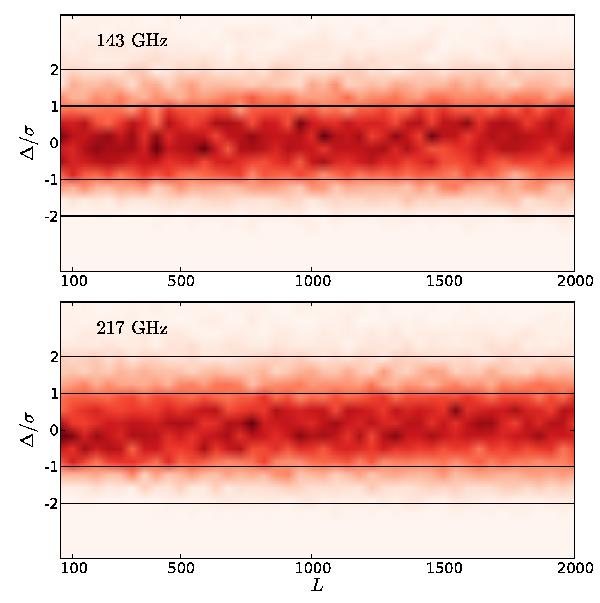
Density plot of the individual deflection power spectra constructed on approximately 400 10deg × 10deg patches for the 143 GHz and 217 GHz channels. The lines are the theoretical 1σ and 2σ error for this patch size. No strong outliers are seen.
Current usage metrics show cumulative count of Article Views (full-text article views including HTML views, PDF and ePub downloads, according to the available data) and Abstracts Views on Vision4Press platform.
Data correspond to usage on the plateform after 2015. The current usage metrics is available 48-96 hours after online publication and is updated daily on week days.
Initial download of the metrics may take a while.