Fig. A.3
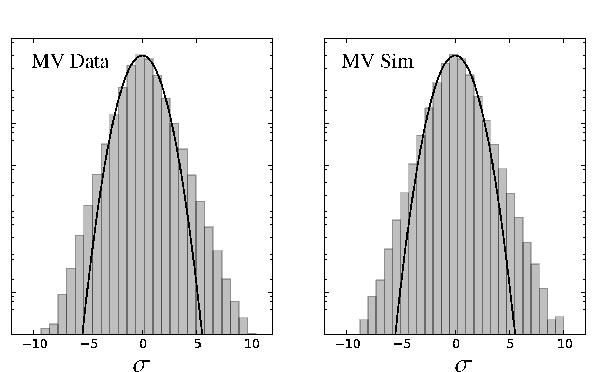
Histogram of pixel values for the unnormalized lensing estimate
![]() for the MV reconstruction, in
units of the standard deviation of the map. A Gaussian with σ = 1 is
overplotted in black. Note that the y-axis is logarithmic. The left
column shows the histogram for the data itself, while the right
column shows a simulated reconstruction. The reconstructed map is
slightly non-Gaussian, but in a way that is expected from simulations given the
non-Gaussian nature of the quadratic lensing estimator.
for the MV reconstruction, in
units of the standard deviation of the map. A Gaussian with σ = 1 is
overplotted in black. Note that the y-axis is logarithmic. The left
column shows the histogram for the data itself, while the right
column shows a simulated reconstruction. The reconstructed map is
slightly non-Gaussian, but in a way that is expected from simulations given the
non-Gaussian nature of the quadratic lensing estimator.
Current usage metrics show cumulative count of Article Views (full-text article views including HTML views, PDF and ePub downloads, according to the available data) and Abstracts Views on Vision4Press platform.
Data correspond to usage on the plateform after 2015. The current usage metrics is available 48-96 hours after online publication and is updated daily on week days.
Initial download of the metrics may take a while.