Fig. A.1
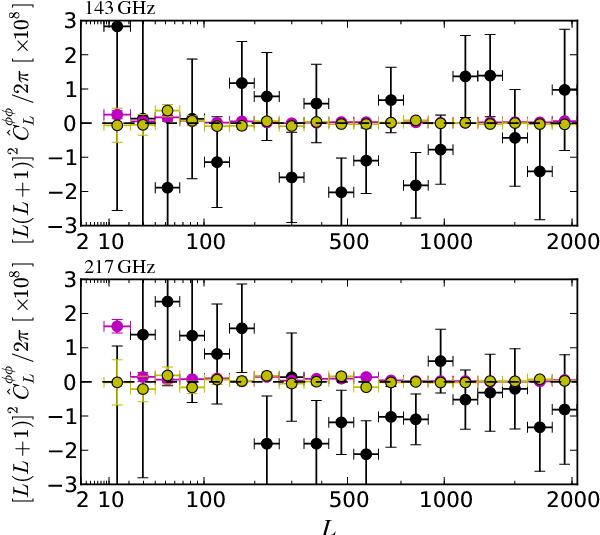
Survey consistency null tests at 143 GHz and 217 GHz. Solid black points show
difference of ![]() estimated separately on the two
six-month surveys of the nominal mission. Magenta points show the auto-spectrum of
estimated separately on the two
six-month surveys of the nominal mission. Magenta points show the auto-spectrum of
![]() obtained from maps made by taking the half-difference of the two surveys
(S1−S2) × (S1−S2).
Yellow points show the cross-spectrum of
obtained from maps made by taking the half-difference of the two surveys
(S1−S2) × (S1−S2).
Yellow points show the cross-spectrum of ![]() obtained on half-difference and half-sum maps (S1−S2) × (S1 + S2). The scatter on
the tests that contain difference maps is very small because (as can be seen in
Fig. 6) most of the lens reconstruction
“noise” is due to primary CMB fluctuations, which is nulled in these tests.
obtained on half-difference and half-sum maps (S1−S2) × (S1 + S2). The scatter on
the tests that contain difference maps is very small because (as can be seen in
Fig. 6) most of the lens reconstruction
“noise” is due to primary CMB fluctuations, which is nulled in these tests.
Current usage metrics show cumulative count of Article Views (full-text article views including HTML views, PDF and ePub downloads, according to the available data) and Abstracts Views on Vision4Press platform.
Data correspond to usage on the plateform after 2015. The current usage metrics is available 48-96 hours after online publication and is updated daily on week days.
Initial download of the metrics may take a while.