Fig. 20
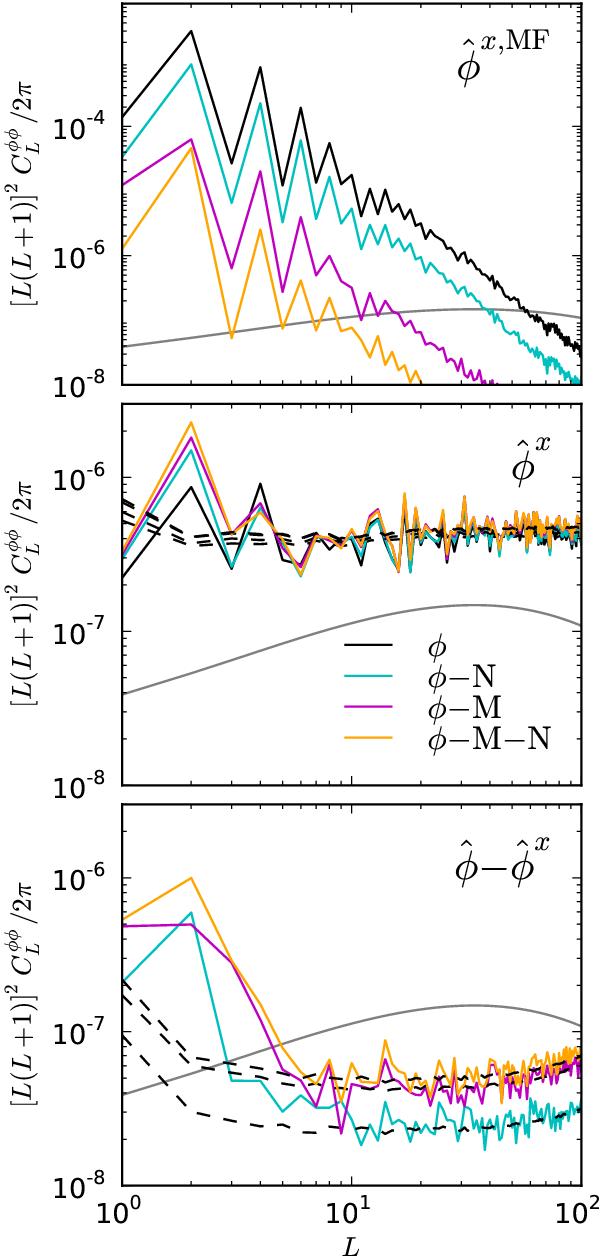
Bias-hardened estimator consistency tests for our MV reconstruction. Following the
discussion in Sect. 7.4 we form estimators
that are bias-hardened against the mean-fields due to inhomgeneous noise levels
(φ-N, cyan), masking (φ-M, magenta), and both of these effects simultaneously
(φ-M-N, orange). The top panel
shows the power spectra of the mean-field for each of these estimators. The
middle panel shows the raw power spectra of the reconstructions
themselves, compared to the average expected from signal+noise (dashed black). The
lower panel shows the power spectrum of the difference between
each bias-hardened estimator and the standard result. Dashed black lines give the
expected average of this difference (measured on simulations). The grey line is the
fiducial ![]() power spectrum. We can see that the
differences are consistent with the expected scatter for all estimators at
L ≥
10.
power spectrum. We can see that the
differences are consistent with the expected scatter for all estimators at
L ≥
10.
Current usage metrics show cumulative count of Article Views (full-text article views including HTML views, PDF and ePub downloads, according to the available data) and Abstracts Views on Vision4Press platform.
Data correspond to usage on the plateform after 2015. The current usage metrics is available 48-96 hours after online publication and is updated daily on week days.
Initial download of the metrics may take a while.