Fig. 18
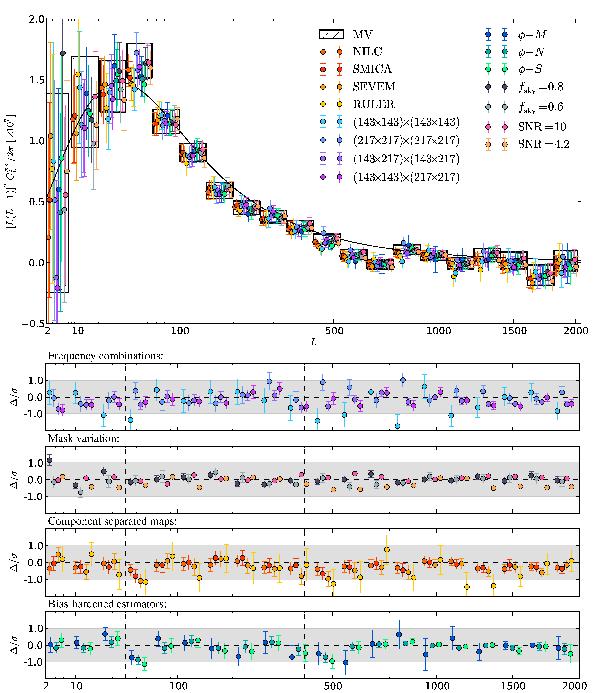
Summary of internal consistency tests between our fiducial minimum-variance (MV)
reconstruction and a set of alternatives designed to test sensitivity to potential
issues. The top panel shows ![]() estimates, with measurement error
bars. The bottom panels show the residual with respect to the MV
reconstruction in units of the MV measurement uncertainty. The grey band marks the
1σ
deviation uncertainty of the MV reconstruction. The error bar on each data point in
the lower panels gives the standard deviation of the scatter between each result and
the MV, determined from Monte-Carlo simulations that account for the correlated CMB,
noise and foreground power between estimators. Comparison of the uncertainty on the
scatter points and the grey band gives an indication of how constraining each test is.
The various tests are described in more detail in subsections of Sect. 7.
estimates, with measurement error
bars. The bottom panels show the residual with respect to the MV
reconstruction in units of the MV measurement uncertainty. The grey band marks the
1σ
deviation uncertainty of the MV reconstruction. The error bar on each data point in
the lower panels gives the standard deviation of the scatter between each result and
the MV, determined from Monte-Carlo simulations that account for the correlated CMB,
noise and foreground power between estimators. Comparison of the uncertainty on the
scatter points and the grey band gives an indication of how constraining each test is.
The various tests are described in more detail in subsections of Sect. 7.
Current usage metrics show cumulative count of Article Views (full-text article views including HTML views, PDF and ePub downloads, according to the available data) and Abstracts Views on Vision4Press platform.
Data correspond to usage on the plateform after 2015. The current usage metrics is available 48-96 hours after online publication and is updated daily on week days.
Initial download of the metrics may take a while.