Fig. 16
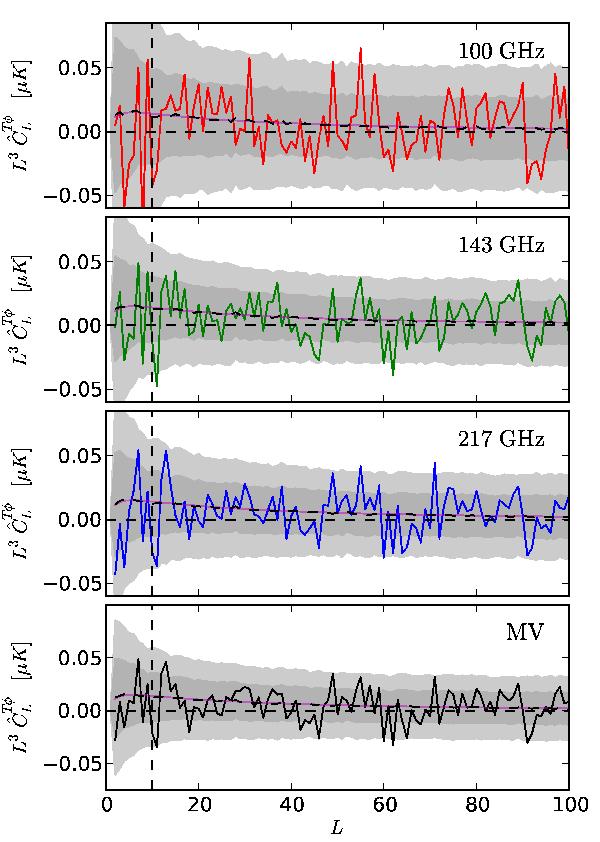
Lensing-ISW bispectrum-related cross spectra computed from Eq. (46). Black dashed lines indicate the
average value for simulations, while dark/light grey filled regions indicate the
expected one/two standard deviation scatter, also measured from simulations. The
thin magenta line gives the expected ![]() cross-spectrum for our fiducial
model. The agreement of this curve with the simulation average illustrates that our
estimator is accurately normalized. In all the quantitative analysis of this section
we ignore L<
10, although we have plotted the cross-spectra at these
multipoles for interest.
cross-spectrum for our fiducial
model. The agreement of this curve with the simulation average illustrates that our
estimator is accurately normalized. In all the quantitative analysis of this section
we ignore L<
10, although we have plotted the cross-spectra at these
multipoles for interest.
Current usage metrics show cumulative count of Article Views (full-text article views including HTML views, PDF and ePub downloads, according to the available data) and Abstracts Views on Vision4Press platform.
Data correspond to usage on the plateform after 2015. The current usage metrics is available 48-96 hours after online publication and is updated daily on week days.
Initial download of the metrics may take a while.