Fig. 14
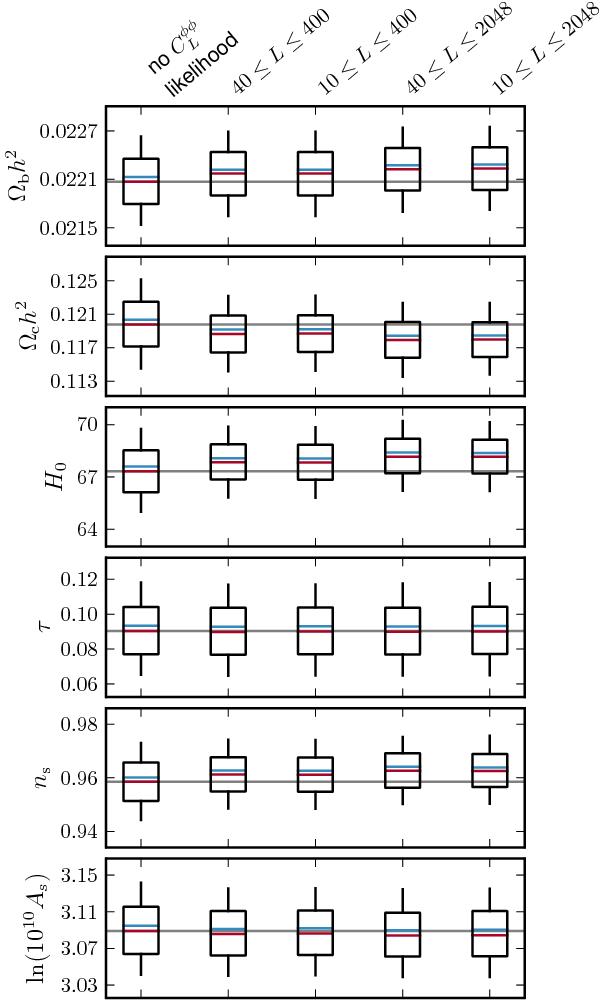
Marginalised posteriors for the six-parameter ΛCDM model, shown as box plots, for Planck+WP+highL with various lensing likelihoods. The red and blue lines are the median and mean, respectively. The box and bar correspond to 68% and 95% of the probability density, both centered on the median. The left-most column is without the lensing likelihood and the median of these constraints is shown by the grey line. The remaining columns show the effect of adding in the fiducial lensing likelihood (second column), and further adding a low-L bin (third column), high-L bins (fourth column), or both (final column).
Current usage metrics show cumulative count of Article Views (full-text article views including HTML views, PDF and ePub downloads, according to the available data) and Abstracts Views on Vision4Press platform.
Data correspond to usage on the plateform after 2015. The current usage metrics is available 48-96 hours after online publication and is updated daily on week days.
Initial download of the metrics may take a while.