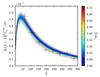
Fig. 12
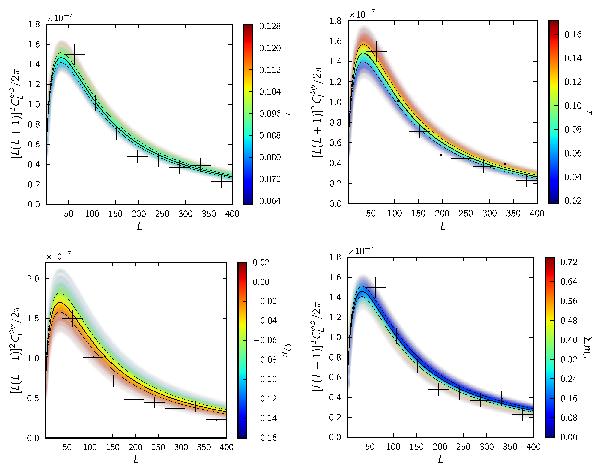
Upper left: Planck
measurements of the lensing power spectrum compared to the ΛCDM mean prediction and 68%
confidence interval (dashed lines) for models fit to
Planck+WP+highL (see text). The eight bandpowers are those used
in the Planck lensing likelihood; they are renormalized, along
with their errors, to account for the small differences between the lensed
![]() in the best-fit model and the
fiducial model used throughout this paper. The error bars are the ± 1σ errors from
the diagonal of the covariance matrix. The colour coding shows how
in the best-fit model and the
fiducial model used throughout this paper. The error bars are the ± 1σ errors from
the diagonal of the covariance matrix. The colour coding shows how
![]() varies with the optical depth
τ
across samples from the ΛCDM posterior distribution. Upper right: as
upper-left but using only the temperature power spectrum from
Planck. Lower left: as upper-left panel but in
models with spatial curvature. The colour coding is for ΩK.
Lower right: as upper-left but in models with three massive
neutrinos (of equal mass). The colour coding is for the summed neutrino mass
∑
mν.
varies with the optical depth
τ
across samples from the ΛCDM posterior distribution. Upper right: as
upper-left but using only the temperature power spectrum from
Planck. Lower left: as upper-left panel but in
models with spatial curvature. The colour coding is for ΩK.
Lower right: as upper-left but in models with three massive
neutrinos (of equal mass). The colour coding is for the summed neutrino mass
∑
mν.
Current usage metrics show cumulative count of Article Views (full-text article views including HTML views, PDF and ePub downloads, according to the available data) and Abstracts Views on Vision4Press platform.
Data correspond to usage on the plateform after 2015. The current usage metrics is available 48-96 hours after online publication and is updated daily on week days.
Initial download of the metrics may take a while.