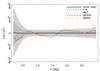
Fig. 9
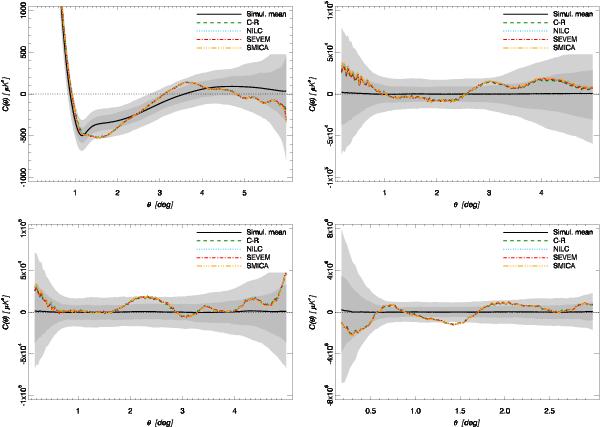
The 2-point (upper left), pseudo-collapsed (upper right), equilateral (lower left) 3-point and reduced rhombic 4-point (lower right) functions averaged over the disc set for the Nside = 2048 CMB estimates. Estimates of the multipoles for ℓ ≤ 60 are removed from the sky maps. The black solid line indicates the mean for 1000 Monte Carlo simulations and the shaded dark and light grey regions indicate the 68% and 95% confidence regions, respectively. See Sect. 4.3 for the definition of the separation angle θ.
Current usage metrics show cumulative count of Article Views (full-text article views including HTML views, PDF and ePub downloads, according to the available data) and Abstracts Views on Vision4Press platform.
Data correspond to usage on the plateform after 2015. The current usage metrics is available 48-96 hours after online publication and is updated daily on week days.
Initial download of the metrics may take a while.