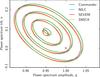
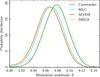
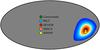
Fig. 32
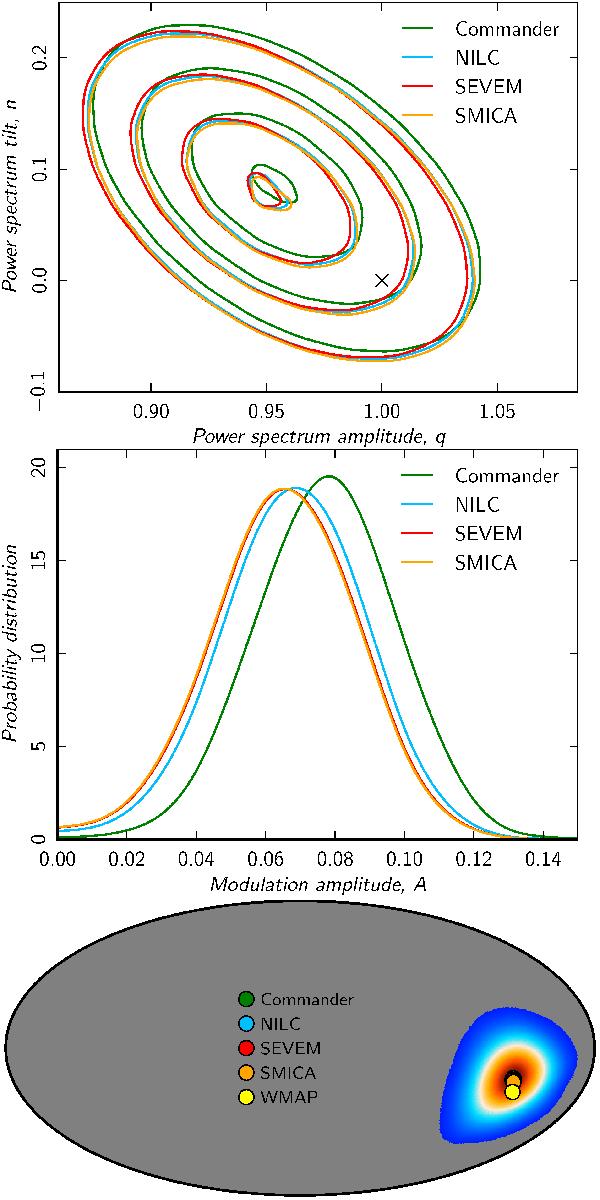
Consistency between component separation algorithms as measured by the dipole modulation likelihood. The top panel shows the marginal power spectrum amplitude for the 5° smoothing scale, the middle panel shows the dipole modulation amplitude, and the bottom panel shows the preferred dipole directions. The coloured area indicates the 95% confidence region for the Commander solution, while the dots shows the maximum-posterior directions for the other maps.
Current usage metrics show cumulative count of Article Views (full-text article views including HTML views, PDF and ePub downloads, according to the available data) and Abstracts Views on Vision4Press platform.
Data correspond to usage on the plateform after 2015. The current usage metrics is available 48-96 hours after online publication and is updated daily on week days.
Initial download of the metrics may take a while.