Fig. 29
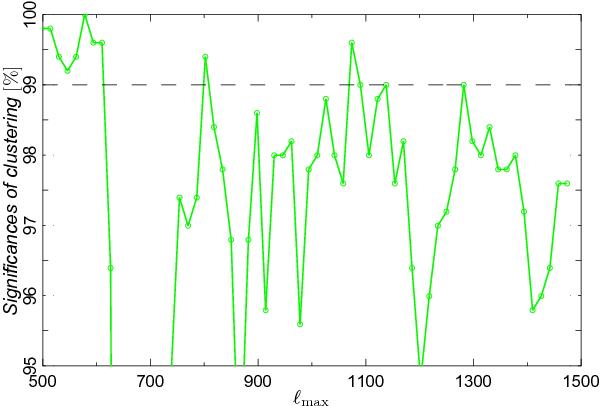
Derived p-values as a function of ℓmax for the deboosted SEVEM 143 GHz foreground-cleaned map. The p-values in this plot are based on the the mean of the angular separations determined between all pairs of dipole directions where one direction falls in the range [ℓlim = 500,ℓmax] and the second direction in the range [2,ℓlim = 500]. The significance is computed using 500 FFP6 simulated maps.
Current usage metrics show cumulative count of Article Views (full-text article views including HTML views, PDF and ePub downloads, according to the available data) and Abstracts Views on Vision4Press platform.
Data correspond to usage on the plateform after 2015. The current usage metrics is available 48-96 hours after online publication and is updated daily on week days.
Initial download of the metrics may take a while.